Dear Steffen and all
Thanks for getting the data which looks ok for me. I would also support to have two levels of TCL for shielded and unshielded links. For me, the shielded link shall have the same mode
conversion performance as the unshielded link.
I have put all the proposals together:
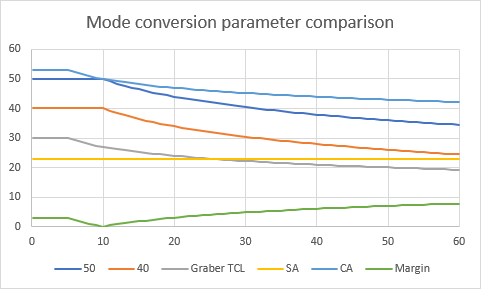
In dark blue and red we have the two proposals for TCL named after their base 50 and 40. The proposal of Steffen is the grey curve. I have added to it the yellow SA(screening attenuation)
line to stay always above the light blue line of TCL based on 50 dB(dark blue line).
The needed minimum value for screening attenuation is 23dB which is considered constant over the frequency range. This is still a light shielded link. The resulting margin between the
two blue lines is shown in green at the bottom. If we would make Steffens proposal also 20dB/decade, then we would have a constant margin over the frequency range.
This looks like a good approach for E1/E2 and adding 10dB for E3.
Any other proposals? I am looking forward to the feedback of our PHY specialists and the discussion leading us closer to a baseline specification.
Best regards
Von: Steffen Graber <steffen@xxxxxxxxxxxxx>
Gesendet: Mittwoch, 7. Juni 2023 15:27
An: STDS-802-3-SPEP2P@xxxxxxxxxxxxxxxxx
Betreff: [802.3_SPEP2P] 802.3dg TCL Measurements
Hello all,
just try to resend the email from two days ago, as it seems, that several did not get it over the reflector ...
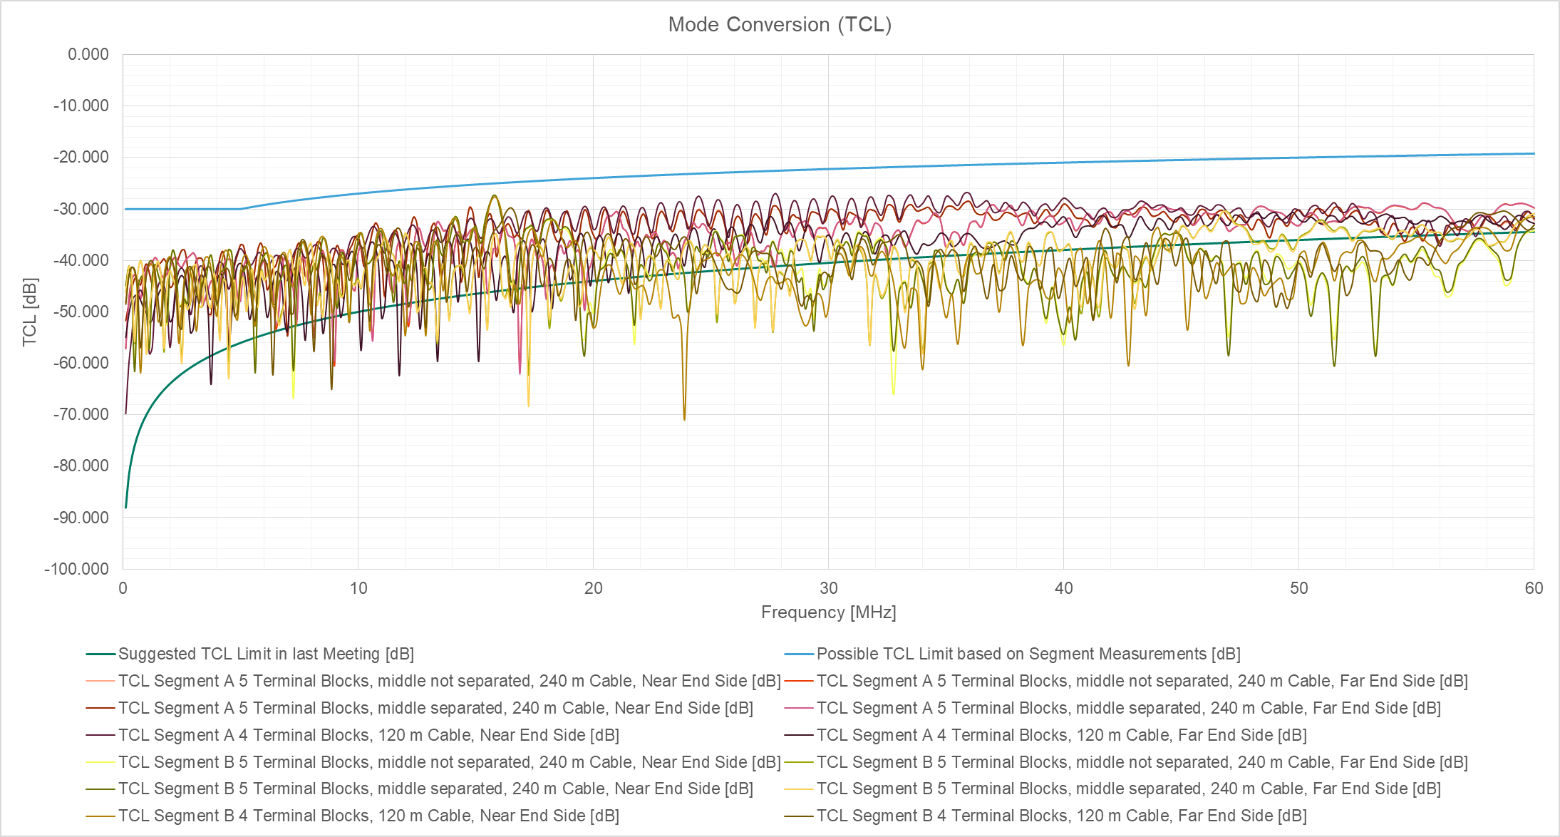
to give some ideas about the TCL values of a practical segment using screw terminals and shielded AWG18 cables, I just calculated the TCL values from the MMVNA-100 raw data of the measurements shown in the presentation
https://www.ieee802.org/3/dg/public/May_2022/graber_3dg_01_03152023.pdf.
The green limit curve is one of the suggested limit lines for TCL during the last meeting (TCL [dB] = 50 – 20 * log10(f / 10), with f in MHz from 0.1 to 60 MHz), an alternative suggestion was to use a curve 10 dB above (TCL [dB] = 40 –
20 * log10(f / 10) ), with f in MHz from 0.1 to 60 MHz).
Looking into the measurement data both suggested limit lines would be exceeded. Partly the connectors, but also the use of a shielded cable (which often has a worse TCL values than a comparable unshielded cable, as it relies also on the
shield for noise attenuation) are likely relevant for exceeding the suggested limits.
Based on the given measurements described in above mentioned presentation, a possible TCL limit could be described by the blue curve below (TCL [dB] = 30 between 0.1 and 5 MHz and TCL [dB] = 27 – 10 * log(f / 10) between 5 MHz and 60 MHz,
f in MHz), or something similar.
Also the question would be if we want to have a TCL limit not only for unshielded segments (as for 10BASE-T1L), but also for shielded segments.
Regards,
Steffen
Segment A is the segment between VNA Ports A (near end) and C (far end), while Segment B is the segment between VNA Ports B (near end) and D (far end) in above mentioned presentation.
To unsubscribe from the STDS-802-3-SPEP2P list, click the following link:
https://listserv.ieee.org/cgi-bin/wa?SUBED1=STDS-802-3-SPEP2P&A=1
To unsubscribe from the STDS-802-3-SPEP2P list, click the following link: https://listserv.ieee.org/cgi-bin/wa?SUBED1=STDS-802-3-SPEP2P&A=1